
What’s In A Number?
The best part of digital marketing is the sheer volume of data that can be pulled from your results. Depending on the platform you’re using, there’s a lot of information to digest and analyze. Dialing in on that information to figure out what has real “meaning” behind it, however, is tricky. And nothing will lead you down the wrong path than focusing on individual metrics versus looking at the big picture.
Here’s an example of how making a judgment based on a single metric can trick you.
Assume there were three stores with social media accounts. Each account had their own set of followers and varied engagement rates. Engagement is very important to social media. It’s a good measure of your content’s quality and relevancy. Low engagement suggests uninteresting, poor quality of content or possibly poor targeting. So, of course, you’d think average engagement rates must be significant, right? So which of these three stores is benefiting the most from social media?
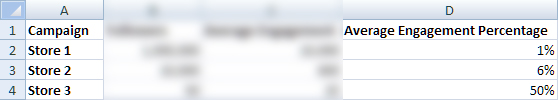
50% average engagement rate suggests amazing content when looking at this variable alone. And store 2, while significantly lower, is still performing well above store 1.
Using only the data we have available above, obviously, Store 3 looks the best. However, as these numbers are percentages, they mean nothing without looking at the raw values used to calculate them.
Let’s take a look at the full chart and see if it changes the perception of these stores:
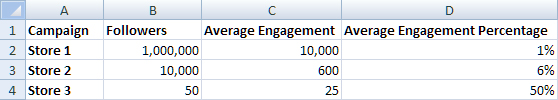
So, looking at the raw value of each page’s social media engagement, it’s obvious that store 1, with only 1% of their followers engaging in content, are still achieving a larger overall number of engagements. And, despite having an unreasonably high engagement rate, store 3 is receiving a pittance compared to the others.
Most business owners would likely want to be Store 1 in this scenario. And, given the simplicity of this explanation, it’s safest to say that’s the most “correct” way of thinking. In the scope of reality, there are so many variables that come into play that it’s not usually that clear. For instance, Store 2 could be targeting their ads to a more specific group, causing their 600 engagements to be likely to shop at their store versus Store 1 displaying ads only to a wide group of users, making a bulk of their 10,000 engagements people who would never shop at their store.
That’s not to say looking at individual statistics is wrong. Engagement rate is one of a metrics to look at when deciding how your digital ad is performing. A higher rate would suggest targeting the right group and using the right message. Using that information, combined with other information such as the overall cost for the advertising, total impressions and conversion rates lets you get the full picture of whether or not to consider the campaign a success or not.
Ultimately, the vast array of data points and their information is always a good thing. More information, when used correctly, is always a boon. It’s just important to know not only what the data itself means, but how it applies to the overall strategy. Don’t fall into the trap of focusing in so closely that you lose sight of the big picture.